Number one of three posts that I’ll publish over the next few weeks.
Although **every blog is different** as a full-time blogger for over 3 years, I thought it might be useful to share my blog stats for my first year of blogging.
The truth is……
It depends.
What a crappy answer!
However, differing blog stats can be caused by a huge number of reasons.
Some of the reasons I’ve seen for blogs getting crazy page views include:
- Having a relatively tight niche, where people are searching for constant inspiration – such as kid’s packed lunches or recipes for a particular diet plan.
- Older blogs (5+years old) when blogging was newer, with less competition. Not only will those blogs have built up loyal followers early on, they’ll also have been improving their blogging skills over that time – which in turn will help attract more followers.
- Having prior experience with blogging – if you’ve blogged before, you’ll probably have a good idea of what works, and the kind of things your ideal audience will engage with.
- Having the ability to put A LOT of hours in – i.e no other work commitments, no small children etc.
- Being able to put a good chunk of money into the blog upfront to pay for photography equipment, editing software, blog design, advertising etc.
- Having a clear business plan with targets, actions and the ability (with time and money) to complete those actions (check out my blogging timetable here).
- Amazing photography and styling skills. Beautiful, eye catching images will always draw in an audience.
Although I don’t have crazy blog views (I average at around 270k-310k views a month), I make a livingfrom blogging, and my husband Chris, has also recently quit his job, in the hope we can expand further.
It’s taken me 3+ years to regularly achieve that number of views, and for the most part, it’s been a slow and steady build.
My background/experience when I started was:
- No prior blogging experience (and hardly any social media experience – I think I’d posted about 10 things on my personal Facebook page *ever* before I started blogging).
- No photography experience – I had no idea how to work a digital camera. BUT – Chris had a decent camera, and had some experience. He took my photos for the first few months, until I was brave enough to start using his camera (on automatic mode at first!)
- I was working full-time for the first 6 months of blogging. Then I took voluntary redundancy. This meant I could focus on the blog full time. I wasn’t earning anything from the blog at the time I quit, but I gave myself 1 year to start earning a minimum of £1000 a month. After that time, I’d have to find another job, as the redundancy money would have run out. In reality, it took me until month 16 to hit the £1000 mark (£1076.10 to be precise), however I had earned around £4000 altogether in those first 16 months, so I managed to stretch the 12 months a little further.
- I didn’t, and still don’t, have a niche – other than the fact that Kitchen Sanctuary is mainly a food/recipe blog. I post healthy food, treat food, Asian food, gluten free food, vegetarian food – basically anything that I enjoy.
- I’m a planner and have always loved timetables and checklists. I started out with a plan, and soon moved on to a yearly, monthly and daily plan, with targets. I revisit my plan regularly (check out my blogging timetable post here). I use my daily plan as my checklist, and tick things off as I go.
- I worked hard to understand how to work my digital camera (on manual mode), how to style a photo and how to edit my images. I’ve taken hundreds of thousands of pictures in the last few years.
So with that info in mind, lets get to my stats for year one of Kitchen Sanctuary. FYI – I started out using the WordPress Jetpack stats, and moved to Google analytics later on in the first year, but the difference between the two isn’t too far out.
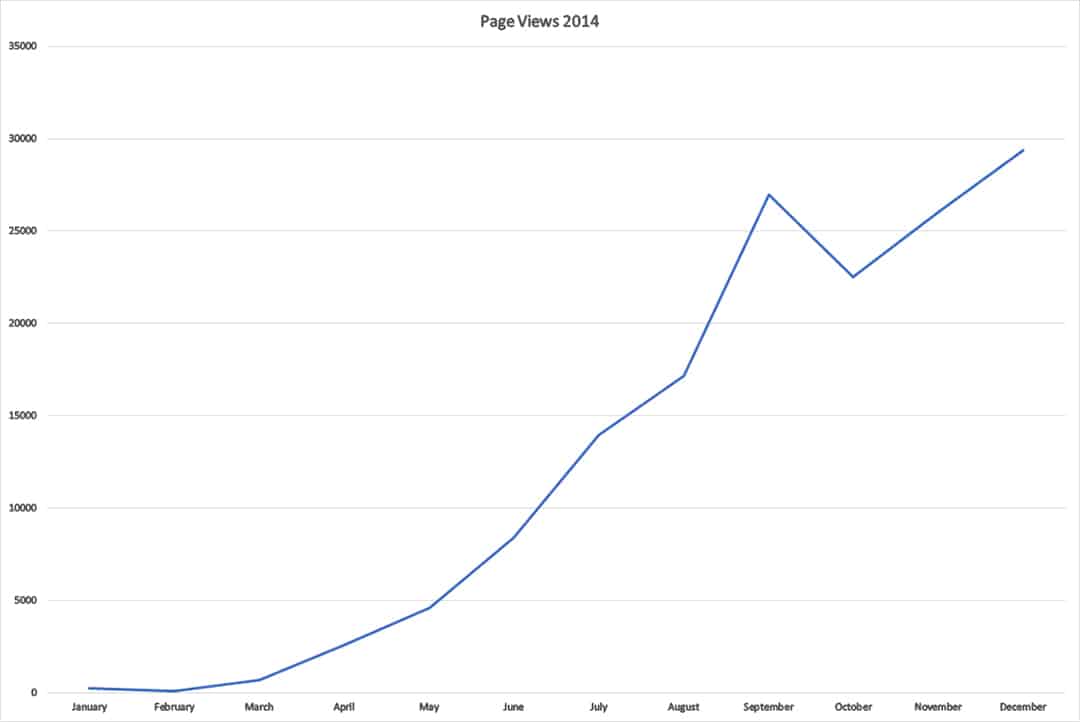
Year one blog stats for Kitchen Sanctuary (2014):
| Jan | Feb | Mar | Apr | May | Jun | Jul | Aug | Sep | Oct | Nov | Dec | |
| Page Views | 246 | 124 | 687 | 2613 | 4631 | 8405 | 13988 | 17164 | 26959 | 22527 | 26025 | 29393 |
| Blog posts published during month | 7 | 5 | 8 | 7 | 11 | 10 | 13 | 12 | 13 | 17 | 12 | 13 |
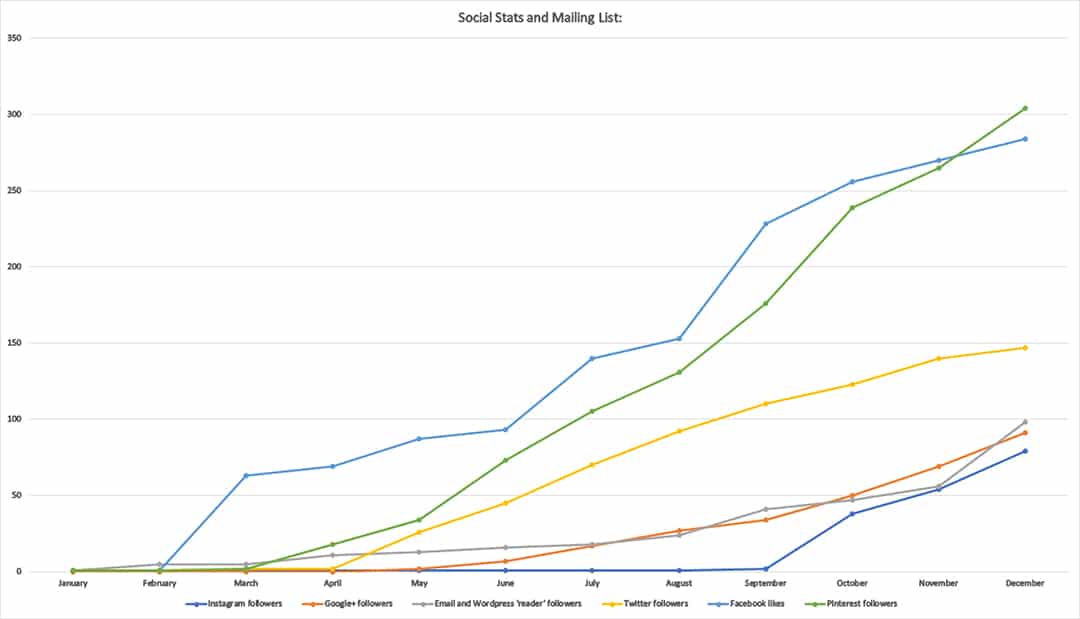
Social Stats and Mailing List:
| Jan | Feb | Mar | Apr | May | Jun | Jul | Aug | Sep | Oct | Nov | Dec | |
| 1 | 1 | 63 | 69 | 87 | 93 | 140 | 153 | 228 | 256 | 270 | 284 | |
| 1 | 1 | 2 | 2 | 26 | 45 | 70 | 92 | 110 | 123 | 140 | 147 | |
| 1 | 1 | 2 | 18 | 34 | 73 | 105 | 131 | 176 | 239 | 265 | 304 | |
| 1 | 1 | 1 | 1 | 1 | 1 | 1 | 1 | 2 | 38 | 54 | 79 | |
| Google+ | 0 | 0 | 0 | 0 | 2 | 7 | 17 | 27 | 34 | 50 | 69 | 91 |
| Mailing List | 1 | 5 | 5 | 11 | 13 | 16 | 18 | 24 | 41 | 47 | 56 | 98 |
Notable actions I took in 2014:
After nearly a whole year of using the WordPress Jetpack email subscription service. I finally moved to Mailchimp in December 2014 and also created an ebook of my top 20 recipes as a free gift to encourage users to sign up to my mailing list. This resulted in a consistent increase in email subscribers (from an average of 10-20 subscribers a month in 2014, going up to 80-100 a month in 2015).
I started using a recipe plugin in August 2014 – this increased my google traffic, bringing it up to be in the top two referrers for my site from around October 2014 (previous to that, google was generally somewhere in my top 5 as a referrer). I definately noticed more traffic from google at this point. Prior to August 2014, my google views were less than 1000 a month. By October I was getting +1500 views, November +2000 views and December +3000 views. I initially though this increase could also have been due to the Thanksgiving/Christmas season, but Jan and Feb 2015 had +5000 views from google.
There was a big spike in traffic in late August/early September – This is because reddit picked up my cookie experiment post.
I started using Google analytics properly in November 2014. This didn’t have any impact on traffic directly, but it did allow me to better monitor my stats (meaning I could see what worked and when, then try to duplicate).
I started posting to Instagram at the end of September – hence the increase in followers from that point.
I started posting to my Kitchen Sanctuary Facebook page at the end of April (but asked my friends to like my page in March) – hence the increase in likes from that point.
I started to consistently create long pins for Pinterest in July-August. I also started sending requests to join Pinterest group boards in September (sent around 10 requests at a time, once every couple of months until I’d built up to 20 group boards). Looking at the graph above, I think quite a sharp increase in Pinterest followers can be seen from August/September. I also started seeing a lot more traffic from Pinterest within a few months after this point (September 2014 was the first time I got over 1000 views from Pinterest during the month!).
Ok, my fingers are aching from all the typing, and I’m sure you must be bored of all the reading by now!
I hope that gives you a good insight into my first year of blogging. Was it enough? too much?
Is there anything missing that you really wanted to see?
Please let me know your thoughts/questions in the comments – or by contacting me on the contact us page. 😀


Nikki, Thank you for this informative post!
My partner and I have started Food Blogging and seeing these stats have helped us see that we are getting somewhere, and we just need to keep on going with it! I love your website and all your recipes are amazing.
Thanks Kay 🙂