Number two of three posts that I’ll publish over the next few weeks (see my year one stats here).
Although **every blog is different** as a full-time blogger for over 3 years, I thought it might be useful to share my blog and social media stats. Here’s all my info for year 2!
I found it easy to publish my year one stats. They were ok. No crazy page views – just a steady growth for someone who is continuing to build and learn.
Year two made me stop and think.
My social media stats continued to grow fairly steadily (at a slightly faster pace than year one), with a little jump here and there, but my page views, although still not huge, did start to improve quite dramatically.
So why did it make me pause in the writing of this post?
I really don’t want people to think that this is normal growth for any blog. Whether you’ve achieved fewer or higher views, one person’s stats shouldn’t be used as a yardstick.
Some people by year two of blogging, have lower stats, and some people will have higher stats. I’ve seen people getting 10k page views a month in the second year and beyond (and making a darn good living from blogging/freelancing). I’ve also seen people getting 1 million+ page views a month within this time frame (my dream number 😁).
There are so many factors that can effect page views. And if you’re looking at page views as a way of calculating a potential income from sponsored work?
Well it just doesn’t work that way.
Lot’s of things can (and should) go into calculating a sponsored post rate, and page views are only a small factor (if even a factor at all).
I think that’s a post for another day!
So why am I sharing my page views?
- I’ve read blog income and traffic reports for a long time. Partly because it’s in my nature to look at numbers and draw conclusions from them. If you’re reading this, I guess you’re one of those people too! (virtual high five ✋).
- I’ve documented my stats from the beginning, it’s all there waiting to be shared!
- Other people’s traffic reports inspire me!! Even the gigantic bloggers (💜Pinch of Yum) who have stats that I could never imagine getting inspire me. They may seem a little intimidating, but I look upon every one I read as a learning opportunity.
- Sharing this info legitimately gives me some time away from recipe creation, photography etc. to really focus on the why’s. It helps me to understand my own blog better – what’s worked, what hasn’t worked, impact of seasonal trends, impact of changes to social media algorithms. All that juicy info is so important in helping me to continue to grow from using that information.
Ok, silly justification over. Lets get on with my year two info.
Year two was a pretty big year for me. It was make-or-break on whether I’d be able to continue blogging, or whether I’d have to go back out and get an office job again.
Fortunately, towards the end of the year, I started consistently earning enough to stay at home. The kids were at school and I had more time to spend trying to improve my photography and to grow my social media presence.
So lets have a look!
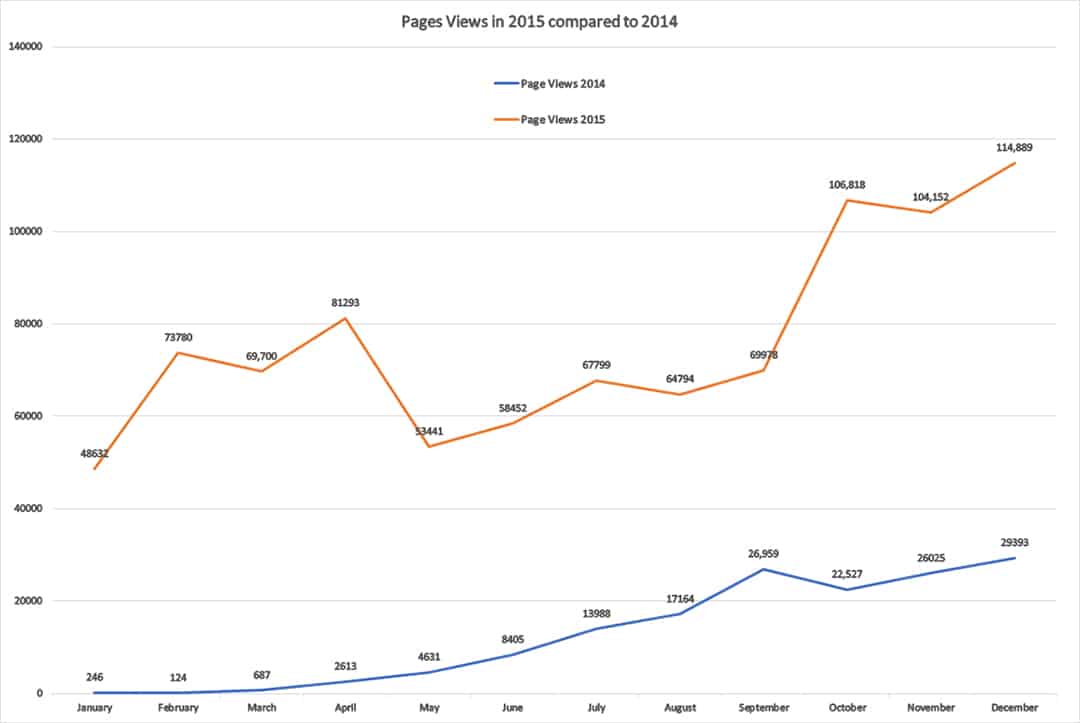
Year two blog stats for Kitchen Sanctuary (2015):
| Jan | Feb | Mar | Apr | May | Jun | Jul | Aug | Sep | Oct | Nov | Dec | |
| Page Views | 48,632 | 73,780 | 69,700 | 81,293 | 53,441 | 58,452 | 67,799 | 64,794 | 69,978 | 106,818 | 104,152 | 114,889 |
| Blog posts published during month |
12 | 13 | 13 | 13 | 13 | 13 | 15 | 13 | 13 | 13 | 13 | 9 |
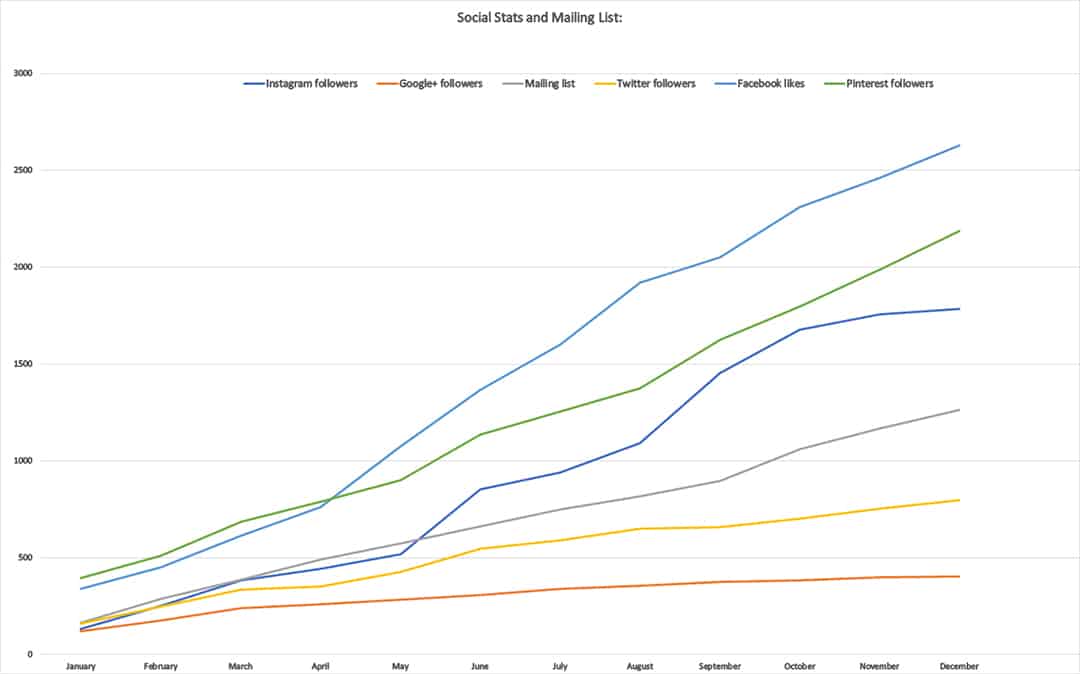
Social Stats and Mailing List:
| Jan | Feb | Mar | Apr | May | Jun | Jul | Aug | Sep | Oct | Nov | Dec | |
| 339 | 451 | 616 | 760 | 1075 | 1365 | 1602 | 1919 | 2052 | 2311 | 2462 | 2627 | |
| 159 | 249 | 336 | 353 | 427 | 548 | 589 | 650 | 659 | 702 | 754 | 798 | |
| 395 | 511 | 688 | 791 | 903 | 1135 | 1255 | 1376 | 1627 | 1797 | 1989 | 2185 | |
| 131 | 251 | 385 | 444 | 518 | 853 | 941 | 1093 | 1455 | 1678 | 1757 | 1785 | |
| Google+ | 121 | 175 | 240 | 262 | 283 | 308 | 338 | 357 | 377 | 383 | 398 | 403 |
| Mailing List | 166 | 289 | 386 | 492 | 574 | 664 | 751 | 816 | 897 | 1061 | 1167 | 1265 |
Notable actions and events in 2015:
- In January I joined Tailwind (<– affiliate link) and started consistently pinning content (at least 20 pins a day). This saw my Pinterest traffic and Pinterest follower numbers jump. Excluding December 2014 (always a busy month for Pinterest), I had been getting 1000-1500 views a month from Pinterest. January saw 5000 views from Pinterest, with the rest of the year being around 4k-6k views from Pinterest each month. Pinterest followers – which had been about 30 ish new followers a month in 2014, started seeing 100+ new followers a month in 2015.
Of course, all this can’t be attributed to Tailwind – I think I would have seen growth anyway due to improvements in photography, more of my content being on Pinterest, and more use of group boards, but I believe it really helped. - In January I also added a Facebook like pop-up to my blog. It’s difficult to say if this had much of an impact on Facebook traffic and follower numbers, as I was generally posting more in Facebook in 2015 and I also started the occasional small (i.e £10-£30) advertising campaign on Facebook from April 2015 (sometimes post boosts and sometimes page advertising).
- In January I started adding affiliate links to Kitchen Sanctuary. Not something that would really impact traffic, but thought I’d include it anyway 🙂
- February saw a jump in traffic in due to one of my posts being included in a roundup on a big blog. This dropped off a little in March, but traffic jumped again in April with a posts being included in 4 round ups on good-size blogs.
- I started my first freelance job in March 2015. By July, I was regularly writing for 5 clients, although this went up and down during 2015. In May I had my first sponsored post (yay!!). This could possibly account for my lower stats during May to September. I was still posting regularly, but it’s likely I wasn’t promoting as much, and possibly my recipe ideas weren’t as well thought as, as I was getting to grips with juggling the extra work.
- In June I took part in a group giveaway – which resulted in an increase in followers on my social media channels.
- In September a popular Instagrammer re-grammed one of my posts – hence the jump in Instagram followers.
- October saw a big jump in traffic (first time over 100k views!!). This was because I got included in 5 buzzfeed roundups and one of my posts went a bit mad on Yummly – with 13k views.
- November I was included in 4 buzzfeed roundups, so this helped maintain the increased traffic through to the typical holiday traffic spike in December.
I hope that gives you a good insight into my second year of blogging.
Is there anything missing that you really wanted to see?
Please let me know your thoughts/questions in the comments – or by contacting me on the contact us page.